Sales Report
The Sales Report is the standard analysis of invoiced sales. Every sales figure quoted in a management meeting should be traceable to a run of this report.
Overview
Section titled “Overview”The report reads confirmed invoices and credit notes. Draft invoices, quotations and open orders are excluded, which is why it will not agree with the order book — and should not.
Opening the report
Section titled “Opening the report”- Reports
- Sales
- Sales Report

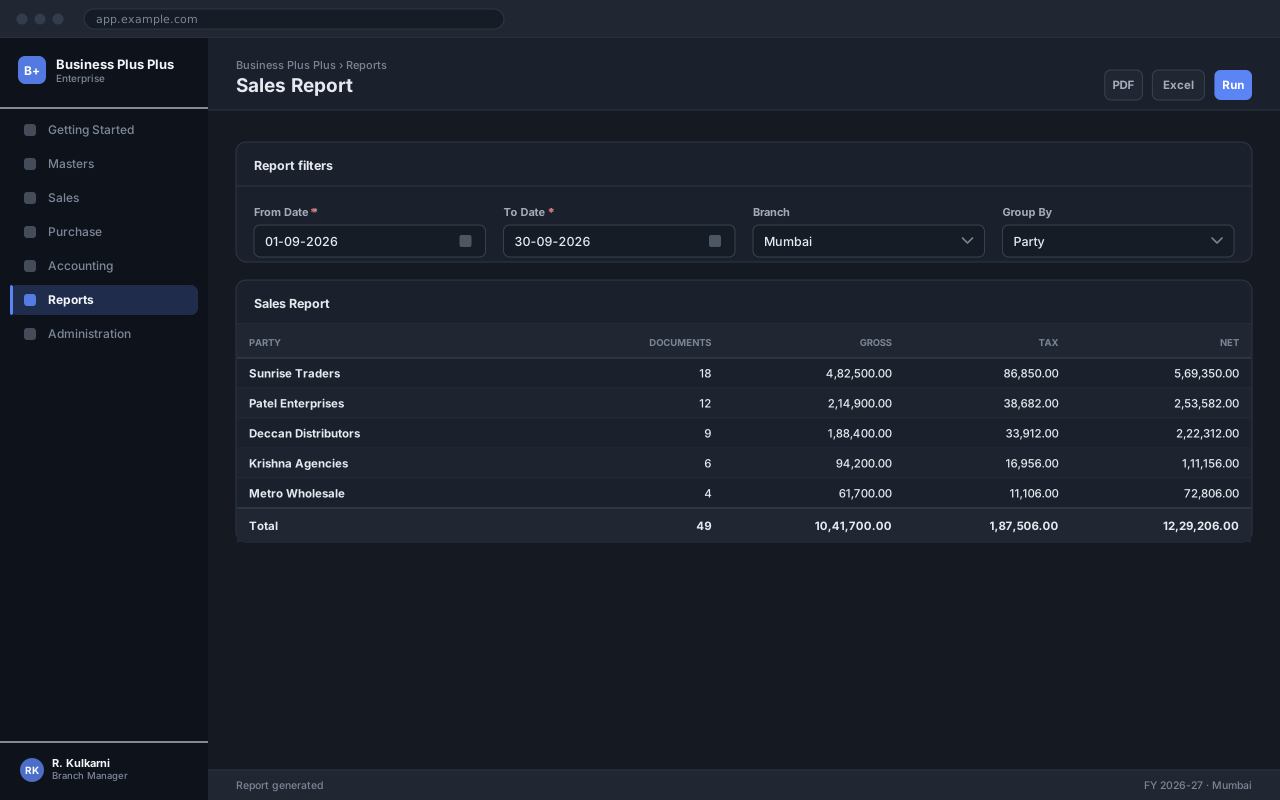
Running the report
Section titled “Running the report”Open the report
Use the navigation path above. The filter panel opens with the current month pre-selected.
Set the filters
Choose the period and any narrowing filters. Leave a filter blank to include everything you have access to.
Run the report
Click Run. Large periods take a few seconds; the row count appears in the status bar when it completes.
Drill down or export
Click any figure to open the documents behind it, or use Excel / PDF to export exactly what is on screen, filters included.
Expected result
The report renders with a total row at the foot, and the status bar shows how many rows were returned.
Filters
Section titled “Filters”| Field | Type | Required | Default | Description | Notes |
|---|---|---|---|---|---|
| From Date | Date | Yes | First day of the current month | Start of the reporting period. | |
| To Date | Date | Yes | Today | End of the reporting period, inclusive. | |
| Branch | Dropdown | No | Your branch | Restrict the report to one branch, or select All. | You only see branches your role grants access to. |
| Group By | Dropdown | No | None | Adds subtotal bands to the report. | |
| Format | Dropdown | No | Summary | Summary shows one row per group; Detailed lists every document. |
Sales Report filters
Columns
Section titled “Columns”| Field | Type | Description |
|---|---|---|
| Date | Date | Invoice date. |
| Invoice No. | Text | Document number. Click to open the invoice. |
| Customer | Text | Billing party. |
| Quantity | Number | Total quantity across the invoice lines, in base UOM. |
| Gross | Amount | Line value before discount and tax. |
| Discount | Amount | Total discount allowed. |
| Taxable Value | Amount | Gross less discount. The figure tax is computed on. |
| Tax | Amount | Total tax charged. |
| Net | Amount | Taxable value plus tax. Ties to the invoice grand total. |
Sales Report columns
Reading the report
Section titled “Reading the report”Exporting
Section titled “Exporting”Exports the current result set as .xlsx, one sheet, with the filter values in the header rows. Formulas are not included — the figures are values.
Produces a print-ready document using the company letterhead configured in Company Settings. Best for anything that leaves the business.
Plain comma-separated values with no formatting, for loading into another system.
Common problems
Section titled “Common problems”The Save button is disabled
A required field is empty or invalid. Fields in error are outlined in red with the reason underneath — scroll up, the first error is usually in the header.
You do not have permission to perform this action
Your role is missing the relevant permission for this screen. Ask an administrator to check it against Roles & Permissions.
The report returns no rows
Widen the period and clear the narrowing filters one at a time. The most common cause is a branch filter that excludes the data you are looking for.
The report times out
Run it for a shorter period, or use the Summary format. Detailed format over a full year can return hundreds of thousands of rows.
Frequently asked questions
Section titled “Frequently asked questions”Why do my totals differ from another report?
Almost always the filters. Check the period, the branch and whether the other report includes cancelled or draft documents. The filter panel values are printed in the export header so you can compare them directly.
Can I schedule this report by email?
Yes — save the filter set as a named view, then attach a schedule to it. The scheduled run uses the saved filters and the permissions of the user who created the schedule.
Does the export match what I see?
Exactly. Exports are generated from the same result set, with the active filters recorded in the header, so a file can be reconciled back to the run that produced it.