Dashboard
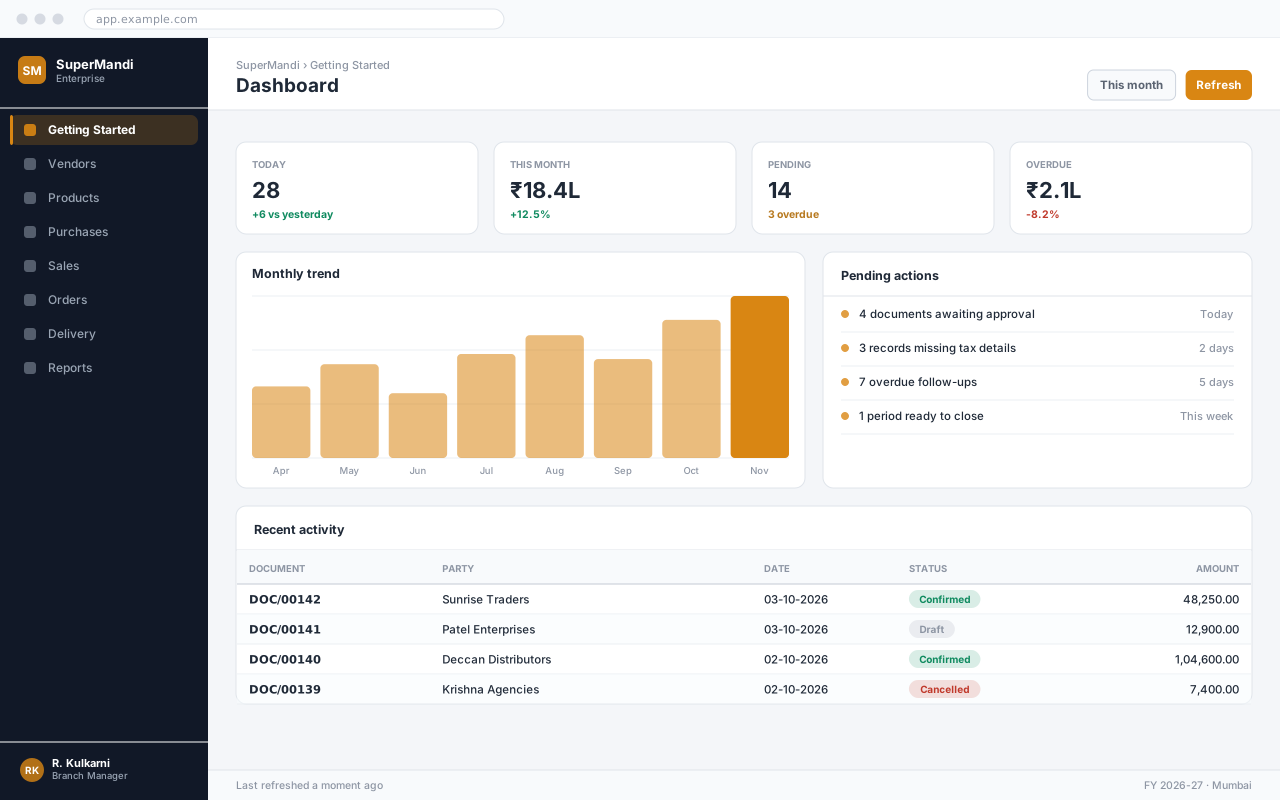
The dashboard is the first screen you see after signing in. It answers one question: what needs my attention today.
Overview
Section titled “Overview”Everything on the dashboard respects your permissions and the branch you signed in to, so two people with different roles see different numbers. That is intended — the dashboard is a personal worklist, not a company report.
Reading the tiles
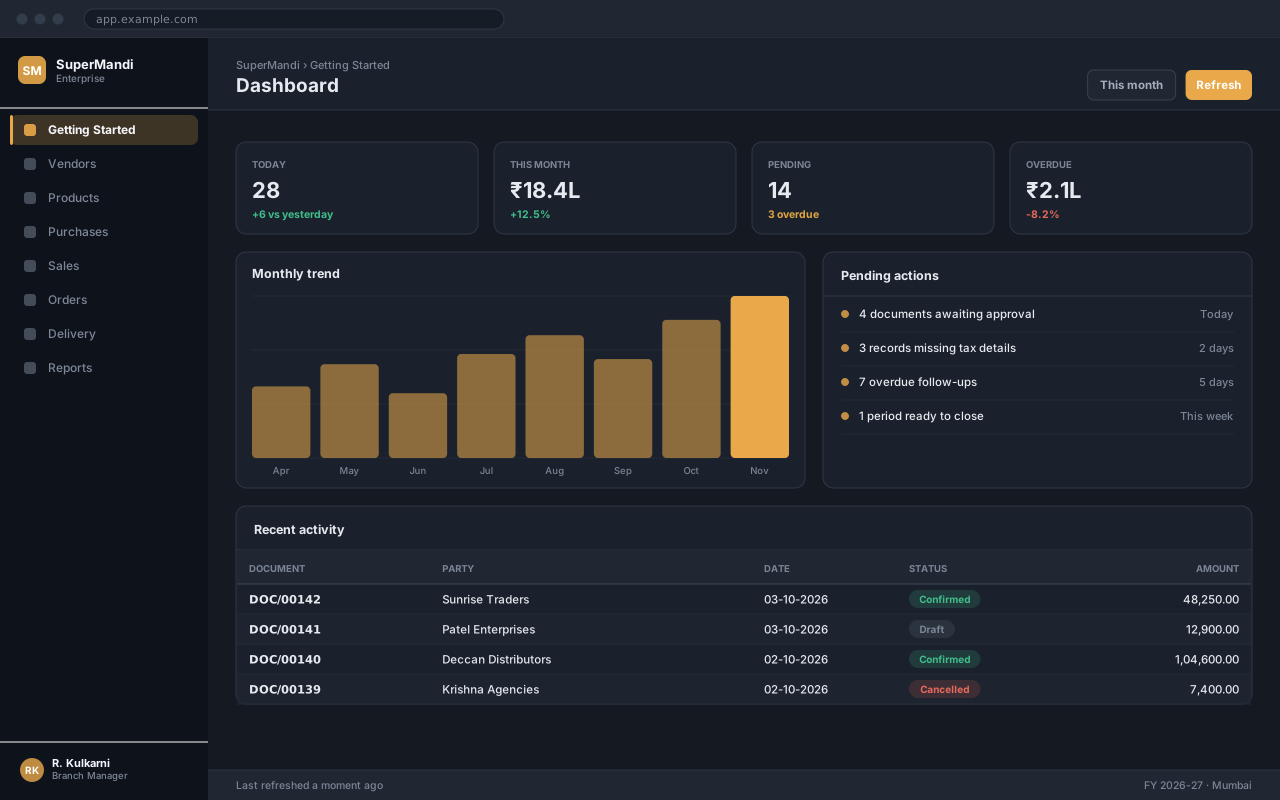
Section titled “Reading the tiles”The tiles across the top are the headline figures for the selected period. Each one is clickable and opens the documents behind it.
Pending actions
Section titled “Pending actions”The list on the right is your queue: documents waiting on you specifically. Clearing it is the fastest way to keep the month-end close on schedule.
Customising the dashboard
Section titled “Customising the dashboard”Open the dashboard settings
Click the gear icon in the top right of the dashboard.
Choose your tiles
Tick the figures you want and drag them into the order you prefer. Up to six tiles are shown across the top.
Set the default period
Pick the period the dashboard opens with. Most users choose This month; branch managers often prefer Today.
Save the layout
Click Save. The layout is stored against your user account, so it follows you to any device.
Expected result
The dashboard reloads with your chosen tiles, in your order, for your default period.
Important notes
Section titled “Important notes”Frequently asked questions
Section titled “Frequently asked questions”Why does my colleague see different numbers?
Tiles are filtered by role, branch and the documents assigned to you. A branch manager sees the whole branch; an executive sees their own work.
Can I export the dashboard?
The tiles themselves are not exportable, but clicking any tile opens the underlying list, which exports to Excel or PDF.
How often do the figures update?
On page load, and whenever you press Refresh or change the period.